What tools and technologies can be used to optimally use budgets for investments in fibre optic infrastructure based on a multi-indicator business and technical analysis for Asta-Net Inc.
The conversation around the network route map:
[Asta-Net]: We are implementing investments under the POPC 1.1 competition (The Operational Programme Digital Poland). We want to add nearby towns to the network which we are building. So which one should we choose?
[inProjects]: Responding quickly and intuitively: this, this and that, but if you want to be sure, we can prepare a detailed analysis 😉
[Asta-Net]: Ok, let’s do this.
How to optimize fibre optic investments?
Over the years, at inProjects, we have created, budgeted and analyzed many times plans for building telecommunications networks. Most often they were fibre-optic networks, but there were also episodes with LTE networks (we worked in this area, among others for big Polish ISP company – P4).
The combination of the experience gained in this way with the everyday design and building of networks and the competencies of an agile team of programmers was a natural start for building tools supporting network routing analysis. The know-how that we have gathered allowed us to create a proprietary system for automatic network routing and costing (Automation of Telecommunications Infrastructure Design Processes), and then in 2021 to build the inTELi platform for the Electronic Communication Office (pol, Urząd Komunikacji Elektronicznej – UKE), about which you can read here.
Detailed multi-index analysis
The publicly available inTELi platform offers a rich set of analyzes described in the knowledge base. However, some customers need to rely on different indicators or data other than those selected by us and ECO at the stage of creating this platform. This is how our cooperation with Asta-Net Inc. began. Łukasz Hetman from the company’s management board approached us with the following issue:
We are implementing the POPC 1.1 investment and are building over 1,500 km of fibre optic network for 21,000 households. We have an additional budget for connecting addresses other than those planned under the POPC project. Can you help us to find those towns and housing estates that are worth connecting in the vicinity of the already planned network?
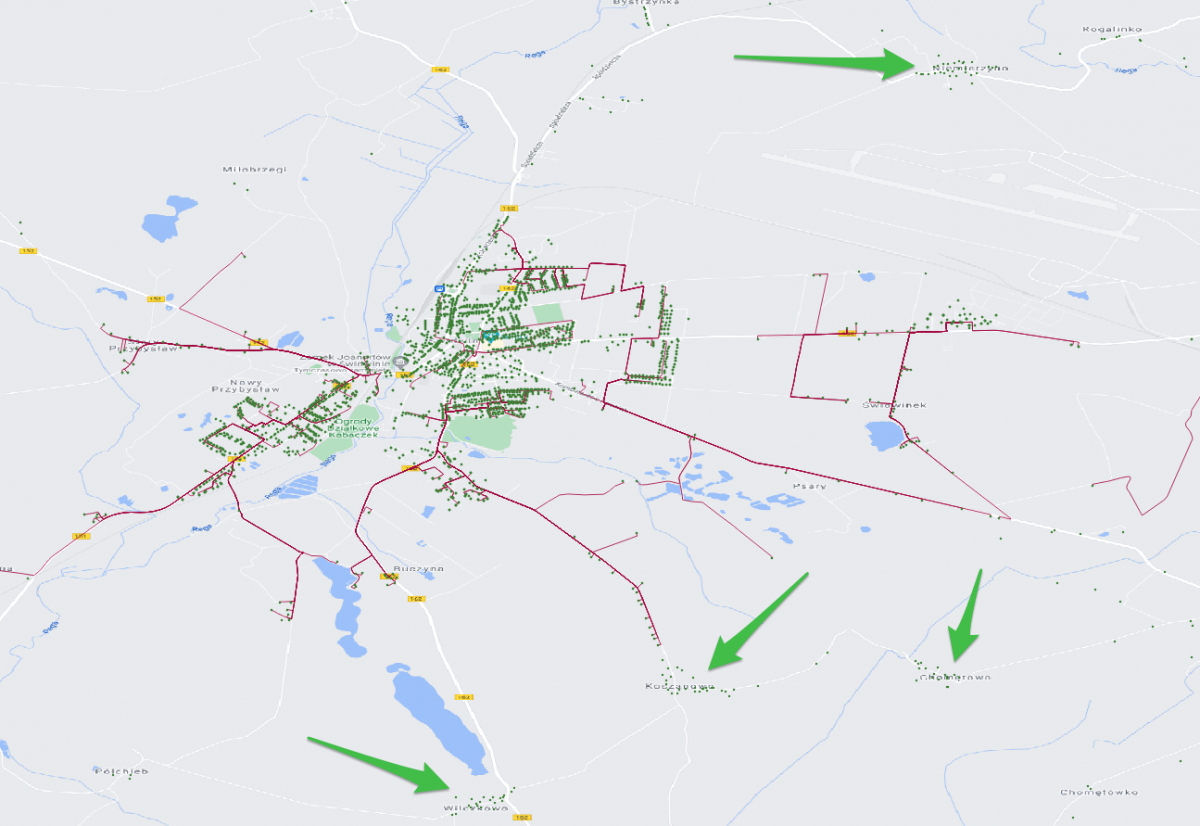
Close to the Asta-Net route planned under the The Operational Programme Digital Poland, there are towns or housing estates, the additional connection of which (“by the way”) will make good business sense. The problem is that you can’t connect all of them, and not all of them will guarantee a return on investment. So which areas should we choose?
The first step may be to use inTEL and send the areas with the largest clusters of households in the vicinity of the planned network for analysis to the platform. The indicators obtained that way will allow ranking the areas in terms of their investment attractiveness. This is how the team of Asta-Net engineers pre-selected the towns that they want to subject to further analysis.
This is where our dedicated analysis began, related to the specific needs of Asta-Net. The scenarios and analytics we have performed were varied.
Selected options for detailed analysis
- Identifying points that are not within the reach of the optical fibre network as key places to be covered.
Asta-Net simplified the definition of white spots by assuming that white spots are those address points that are not within the fibre optic range. The current definition of “white spots” (based on the EU guidelines) is a bit different – it is based only on the bit rate in which a given point is within the range, which means that a household within the range of e.g. a high-speed xDSL network is not a white spot).
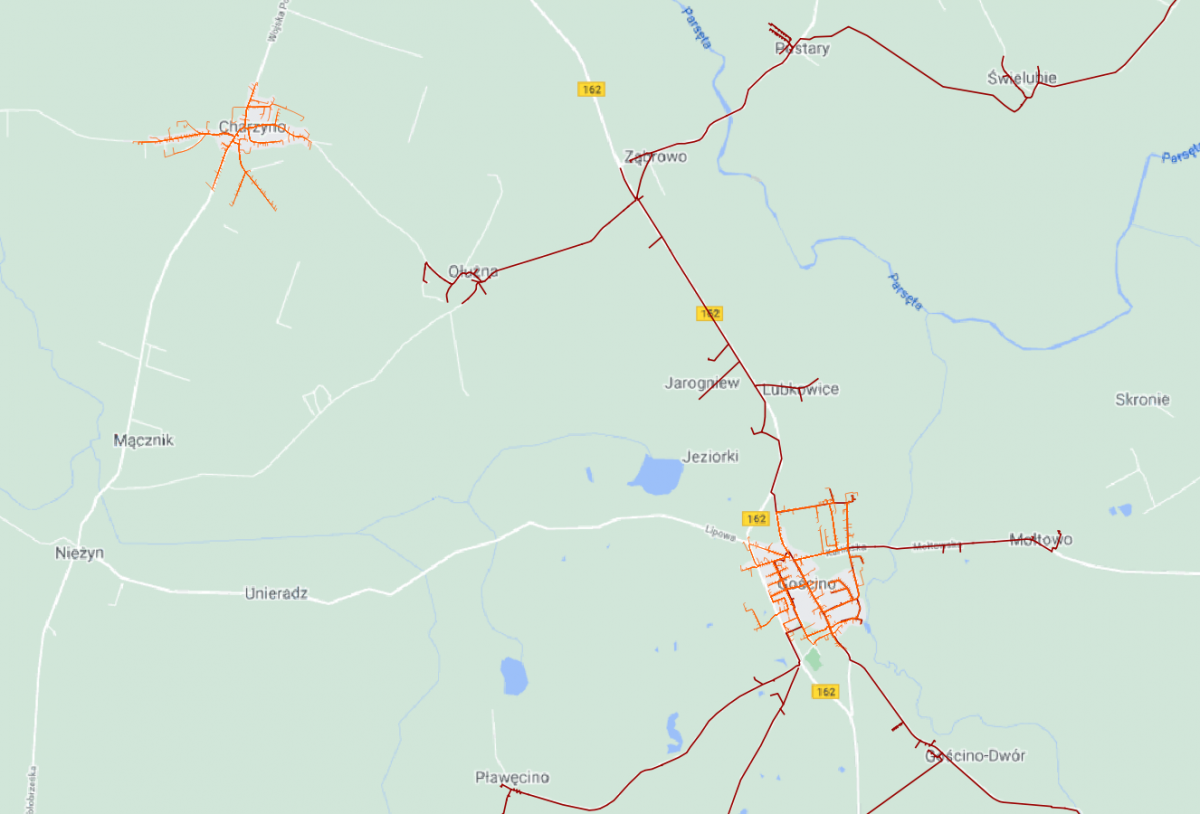
- Multi-variant, automatic network routing
Asta-Net with our help analyzed several scenarios of building the network in “additional” areas:
- to all address points (no matter whether “white” or “black”),
- only to whites,
- only to those that are not within the range of the fibre optic link,
- excluding the list of points provided by Asta-Net with the indicated tolerance (distance).
For each variant, we performed an automatic network routing to find out its potential length. The analysis included Asta-Net’s own data:
- the location of own nodes to which we refer,
- the course of existing networks that we should take into account

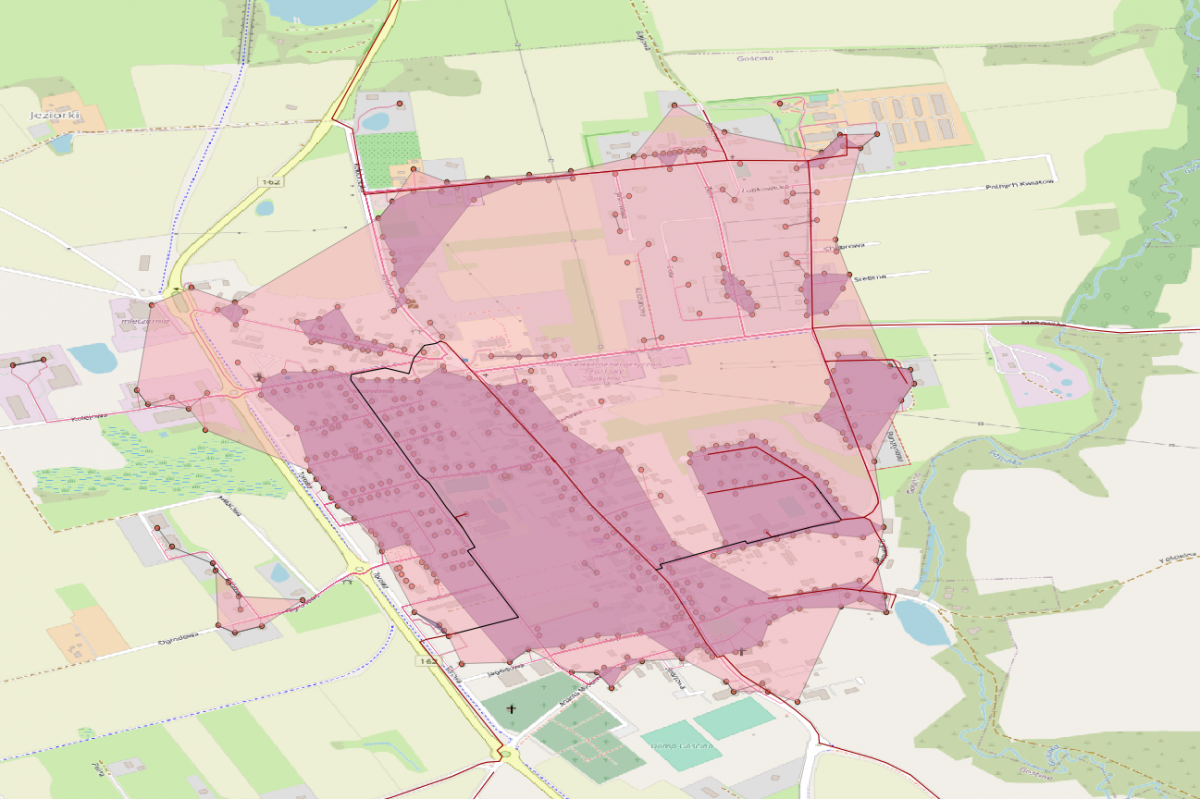
- Clustering to optimize network length in an area
Within the analyzed areas, together with engineers from Asta-Net, we tried to find such parts that would be the most profitable from the point of view of infrastructure construction. To limit the route of the network to the most profitable fragments of the area, we performed clustering using the DBSCAN method for each area, searching for such address point clusters, the maximum distance between the points of which does not exceed 100m, and the total number of households is not less than 5.
What are the results of the analysis?
We worked iteratively with Asta-Net. Together and quickly, we made decisions about giving up excessively time-consuming or overly complicated paths. Finally, the data and indicators generated during the analyzes were visualized and included in the layer attribute tables in the qGIS project.
As a result of the analyzes, Asta-Net received the necessary information enabling it to make a business decision. Based on the analyzes described above and the known (from experience) average cost of building 1m of a fibre optic network, the operator can define the limit values of parameters for which he decides to undertake the investment within the available budget.
We look forward to working with you!
The inTELi platform, which we had the pleasure to create, is a great tool for a quick and, above all, multiscale analysis of the profitability of the planned linear infrastructure – so it is worth using it when selecting the best areas for investment.
We are aware that some projects carried out by operators have their own specificity and must be adapted to a specific situation. If you need a dedicated analysis, which includes specific investment conditions, please contact us: wojciech.kozicki@inprojects.pl.